1950
1975
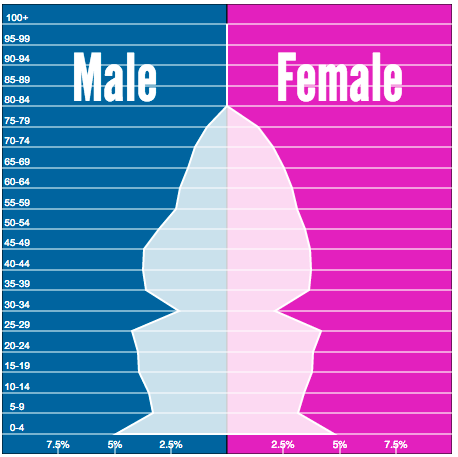
2000
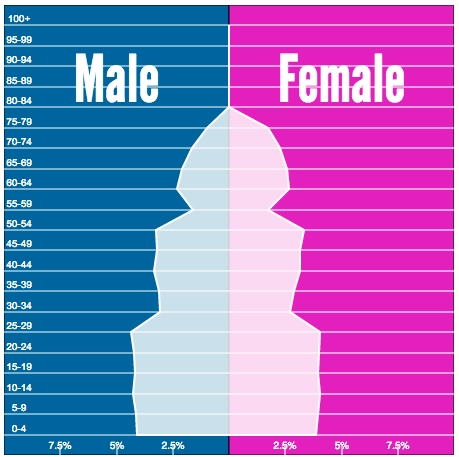
2015
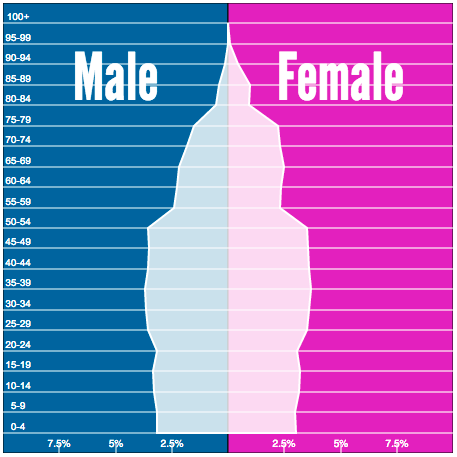
2050
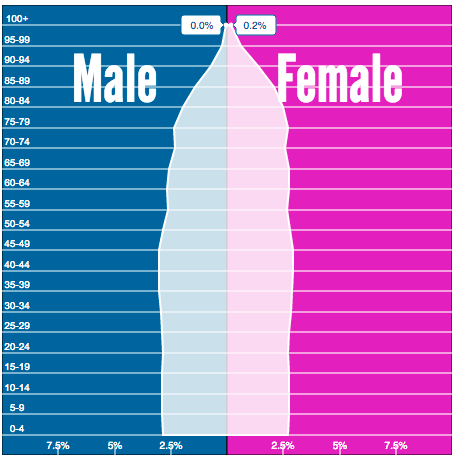
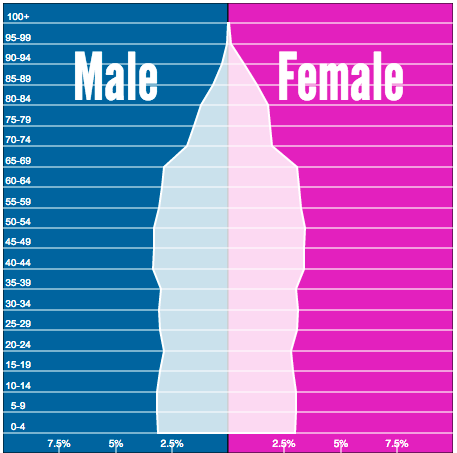
2099
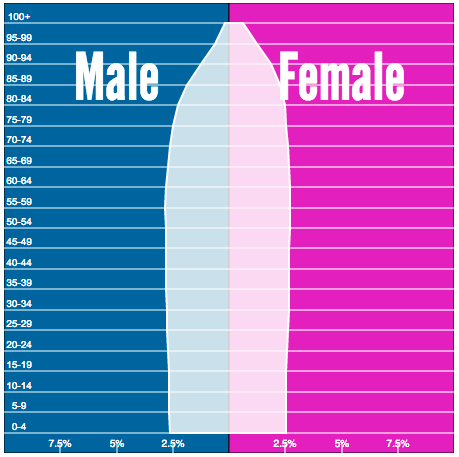
In 1950, the population of France had few children and few senior citizens. Most people during that time were 35 to 50. In 1975, the population began to have more children and the older population decreases. This was because the death rate of children began to decrease and people lived longer. In 2000, the population started getting older and the amount of children decreased. This is a result of an increase in the medical field which resulted in an increased life expectancy and decreased infant mortality rate. France currently has a IMR of 3.3 deaths per 1,000 live births. In 2015, more children were being born and the mid-aged people became older and increased the amount of elderly in the population. The population pyramid from 2015 is additional evidence that France is in stage four of the Demographic Transitional Model. The ratio of males to females in France is 0.75 males for each female. This is because as they age, men tend to die earlier at age 78.7 as opposed to females who live to an age of 85.2 years. In general France has a low CDR. The CDR is 9.3 deaths per 1,000 people. This may be due to the obesity rate of 25.7% which is lower than that of the United States at 35%. They also have a low MMR of 8 deaths per 1,000 people.The CBR is 12.3 births per 1,000 people. There are family friendly tax policies in France and generous maternity and paternity leave policies that contribute to the high fertility rate. Therefore, the birth rate and death rate are almost equal, resulting in low or zero population growth. Finally, the French healthcare system is recognized as one of the best in the world. This program is funded mostly by the government. Population pyramids of 2050 and 2099 have an even population throughout all age groups. This is because the difference between the death rate and the birth rate is decreasing.
